air quality intro

Air Quality

We recognize the potential impacts our operations have on the environment, including air quality. Our strategic positioning in scrap-based EAF steelmaking technology means our operations produce fewer air emissions than the industry sector. CMC strictly follows all air regulations and annually tracks emissions from nitrogen oxides, sulfur oxides, carbon dioxide, methane, nitrous oxide, carbon monoxide, lead, volatile organic compounds and particulate matter. While our EAF mills are closely regulated under federal Clean Air Act permitting requirements, we are motivated to continue reducing our air emissions to minimize our impact. We are confident that the best opportunity to do this lies in our relentless pursuit of energy and raw material efficiency and we continually look for new and innovative technologies to reduce our emissions. We believe that low emissions and efficient operations go hand in hand and have found that as we improve our operational and energy efficiency, emissions decrease as well.

Environmental Footprint (Air Quality) Unit 2022 2021 2020
Nitrogen oxides (NOX) MT 865 789 808
Sulfur oxides (SOOX) MT 593 602 586
Carbon dioxide (CO2) MT 1,078,876 1,065,377 1,052,342
Methane (CH4) MT 138 138 138
Nitrous oxide (N2O) MT 0.798 0.872 0.854
Carbon monoxide (CO) MT 4,298 4,084 -
Lead (Pb) MT 1.237 2.045 -
Volatile organic compounds (VOCs) MT 217 228 -
Particulate matter (PM) MT 412 447 395
waste intro

Waste

Our company is subject to provisions under federal, state and local laws governing waste. As an EAF steelmaker using recycled steel as the primary raw material in our process, CMC incorporates circular economy principles into our business model.

Environmental Footprint (Waste & Co-Products) Unit 2022 2021 2020
Total waste & co-products MT 1,136,908 1,137,902 1,087,782
Total hazardous waste MT 63,635 62,124 64,223
   Percent total waste % 5.6% 5.5% 5.9%
Total waste recycled % 89.5% 83.3% 86.5%
Significant spills reported # 0 0 0
water intro

Water

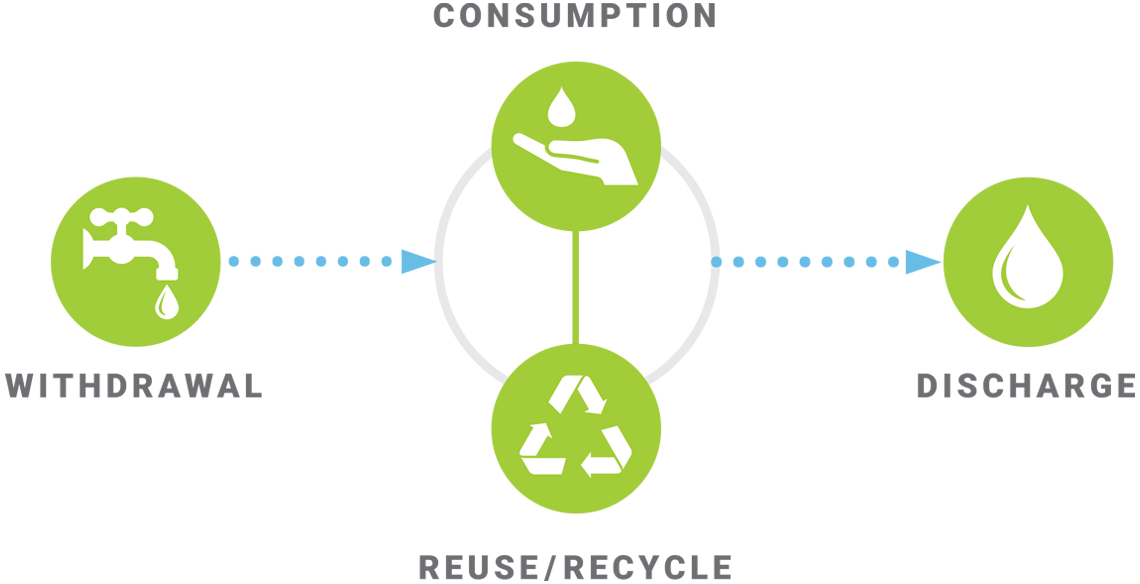
Our water use is an important metric for CMC, and we have established goals to reduce our overall water intensity. In addition to complying with applicable water laws and regulations, CMC facilities utilize water in a cascading recycling system to reduce water withdrawal. CMC is subject to provisions of the Clean Water Act, which imposes restrictions and controls regarding discharges.

Environmental Footprint (Water) Unit 2022 2021 2020
Total water withdrawn m3 6,502,681 7,028,693 6,003,220
   Water withdrawn from public inlet m3 2,238,748 2,074,992 1,960,406
   Water withdrawn from ground water (private well) m3 2,872,075 3,474,309 2,669,751
   Water withdrawn from surface water (stream) m3 1,391,858 1,479,392 1,373,063
Total water discharge m3 1,696,404 1,925,927 1,373,250
Total water consumption m3 4,806,277 5,102,767 4,629,969
Total water withdrawn intensity m3/MT 1.130 1.241 1.083
Water that is recycled or reused
multiple times
% 88.4% 89.6% 95.2%
Total water withdrawn in high or extremely
high baseline stress area
m3 2,675,505 999,324 1,101,440
Water withdrawn in high or extremely
high baseline stress area
% 41% 14% 18%
Total water consumed in high or extremely
high baseline stress area
m3 2,189,788 982,568 1,081,311
Water consumed in high or extremely
high baseline stress area
% 46% 19% 23%

Water Use

water splash background
water usage cycle

Goal

Decrease our water withdrawal
intensity by 8%

Water Withdrawal Intensity (m3 / MT )

In 2022, we experienced a 1.9% reduction in water withdrawal intensity as compared to 2019.

Water reuse is an important part of CMC’s sustainability strategy. We re-purpose water for use in dust suppression, cooling and irrigation. Some of our facilities have achieved zero discharge. Regulatory agencies encourage water reuse, and we withdraw far less water than others in our industry.

This is one pivotal piece of the puzzle that enables us to act with environmental accountability in every aspect of our operations.

Current Progress Towards Goal

2022 2021 2020

Results

1.7%

decrease
since 2019*

Based on 2019 baseline value of 1.152 m3/MT.

Water Withdrawal Intensity

96%

lower than the industry average

Water Withdrawal Intensity

(m3 / MT )

CMC Total² Industry Average¹

Results

96%

lower

1 Industry averages taken from the World Steel Association 2020 Water Management policy paper
2 CMC data is 2021 water withdrawal intensity.

land intro

Land Use

As a major recycler of scrap steel, CMC does not own or operate any mining operations, which are subject to high risk or negatively affecting biodiversity. By using recycled steel in our manufacturing process, we do not contribute to the mining of virgin iron ore materials, which results in land use change and possible impacts on biodiversity and disturbance of wildlife. While CMC does not own or operate any forestry operations, we seek opportunities to restore and protect natural habitats. For instance, CMC Steel Oklahoma created 4,835 linear feet of stream bed with a large, 100-foot-wide riparian zone planted with thousands of native trees and grasses. The stream has created an area for native wildlife to flourish, and the area as a whole is protected from future development.

We have made important changes to our Website Privacy and Cookies Policy. By continuing to use our site you are agreeing to the terms of the policy. To understand what this means for you and your data, please click here to access our Website Privacy and Cookies Policy.

Dismiss